- Water demand
- Peak flow requirements
- Pumping energy
- Infrastructure burdens
- Operational complexity
Conventional vs. Ultra-Low Flow
Compare accepted industry standard drip irrigation on the left against the new ultra-low flow standard on the right.
Left: Conventional
Accepted Industry Standard --
Accepted Industry Standard --
Conventional
- Drops/sec
- --
- Drops/hr
- --
Nano Flow
- Drops/sec
- --
- Drops/hr
- --
Right: Nano Flow Irrigation
New Ultra-Low Flow Rate Standard --
New Ultra-Low Flow Rate Standard --
Pilot Planning 2026
Continuous ultra-low flow irrigation
Heavy-wall half-inch drip line designed to run continuously at roughly 1% of conventional flow.
~1% flow rate reduces demand for
Water
Energy
Infrastructure
The Challenge
Maintaining Agricultural Productivity Under Increasing Resource Constraints
Agriculture faces growing pressure to produce more with fewer resources. Water scarcity, energy costs, infrastructure limitations, and competing demands on water supplies are reshaping how irrigation systems must operate.
While modern irrigation has dramatically improved efficiency, most systems still rely on delivering relatively large volumes of water over short periods of time, requiring substantial pumping capacity, storage, filtration, and distribution infrastructure.
The next generation of irrigation may require a different approach.
Beyond Water Savings
Decoupling Agricultural Productivity from Water Delivery Constraints
Nano Flow Irrigation is exploring whether productive agriculture can be maintained with dramatically lower irrigation demand by shifting from flow-driven irrigation toward demand-based water delivery.
- Crop establishment
- Root-zone moisture management
- Productive growing conditions
- Long-term agricultural resilience
Rethinking Irrigation for a Water-Constrained Future
Across many agricultural regions, the challenge is improving irrigation efficiency to do more with less!
The challenge is maintaining productive agriculture as water, energy, and infrastructure become increasingly constrained.
Nano Flow Irrigation is developing and evaluating ultra-low flow irrigation systems designed to help growers adapt to these changing conditions.
Low operating pressure range with substantially lower friction loss at reduced flow velocity.
Ultra-low discharge range for continuous surface or subsurface irrigation layouts.
Configured around field conditions, delivery method, and reservoir strategy.
From Water Delivery to Water Availability
Irrigation Was Designed Around Flow. We Designed Around Demand.
Ultra-low flow irrigation technology designed to help agriculture adapt to increasing water constraints, rising energy costs, and evolving resource demands.
Water
Lower demand
Continuous delivery designed closer to root-zone need.
Energy
Lower peaks
Reduced flow rates can reduce pumping and pressure burden.
Infrastructure
Smaller loads
Systems can be planned around the water actually available.
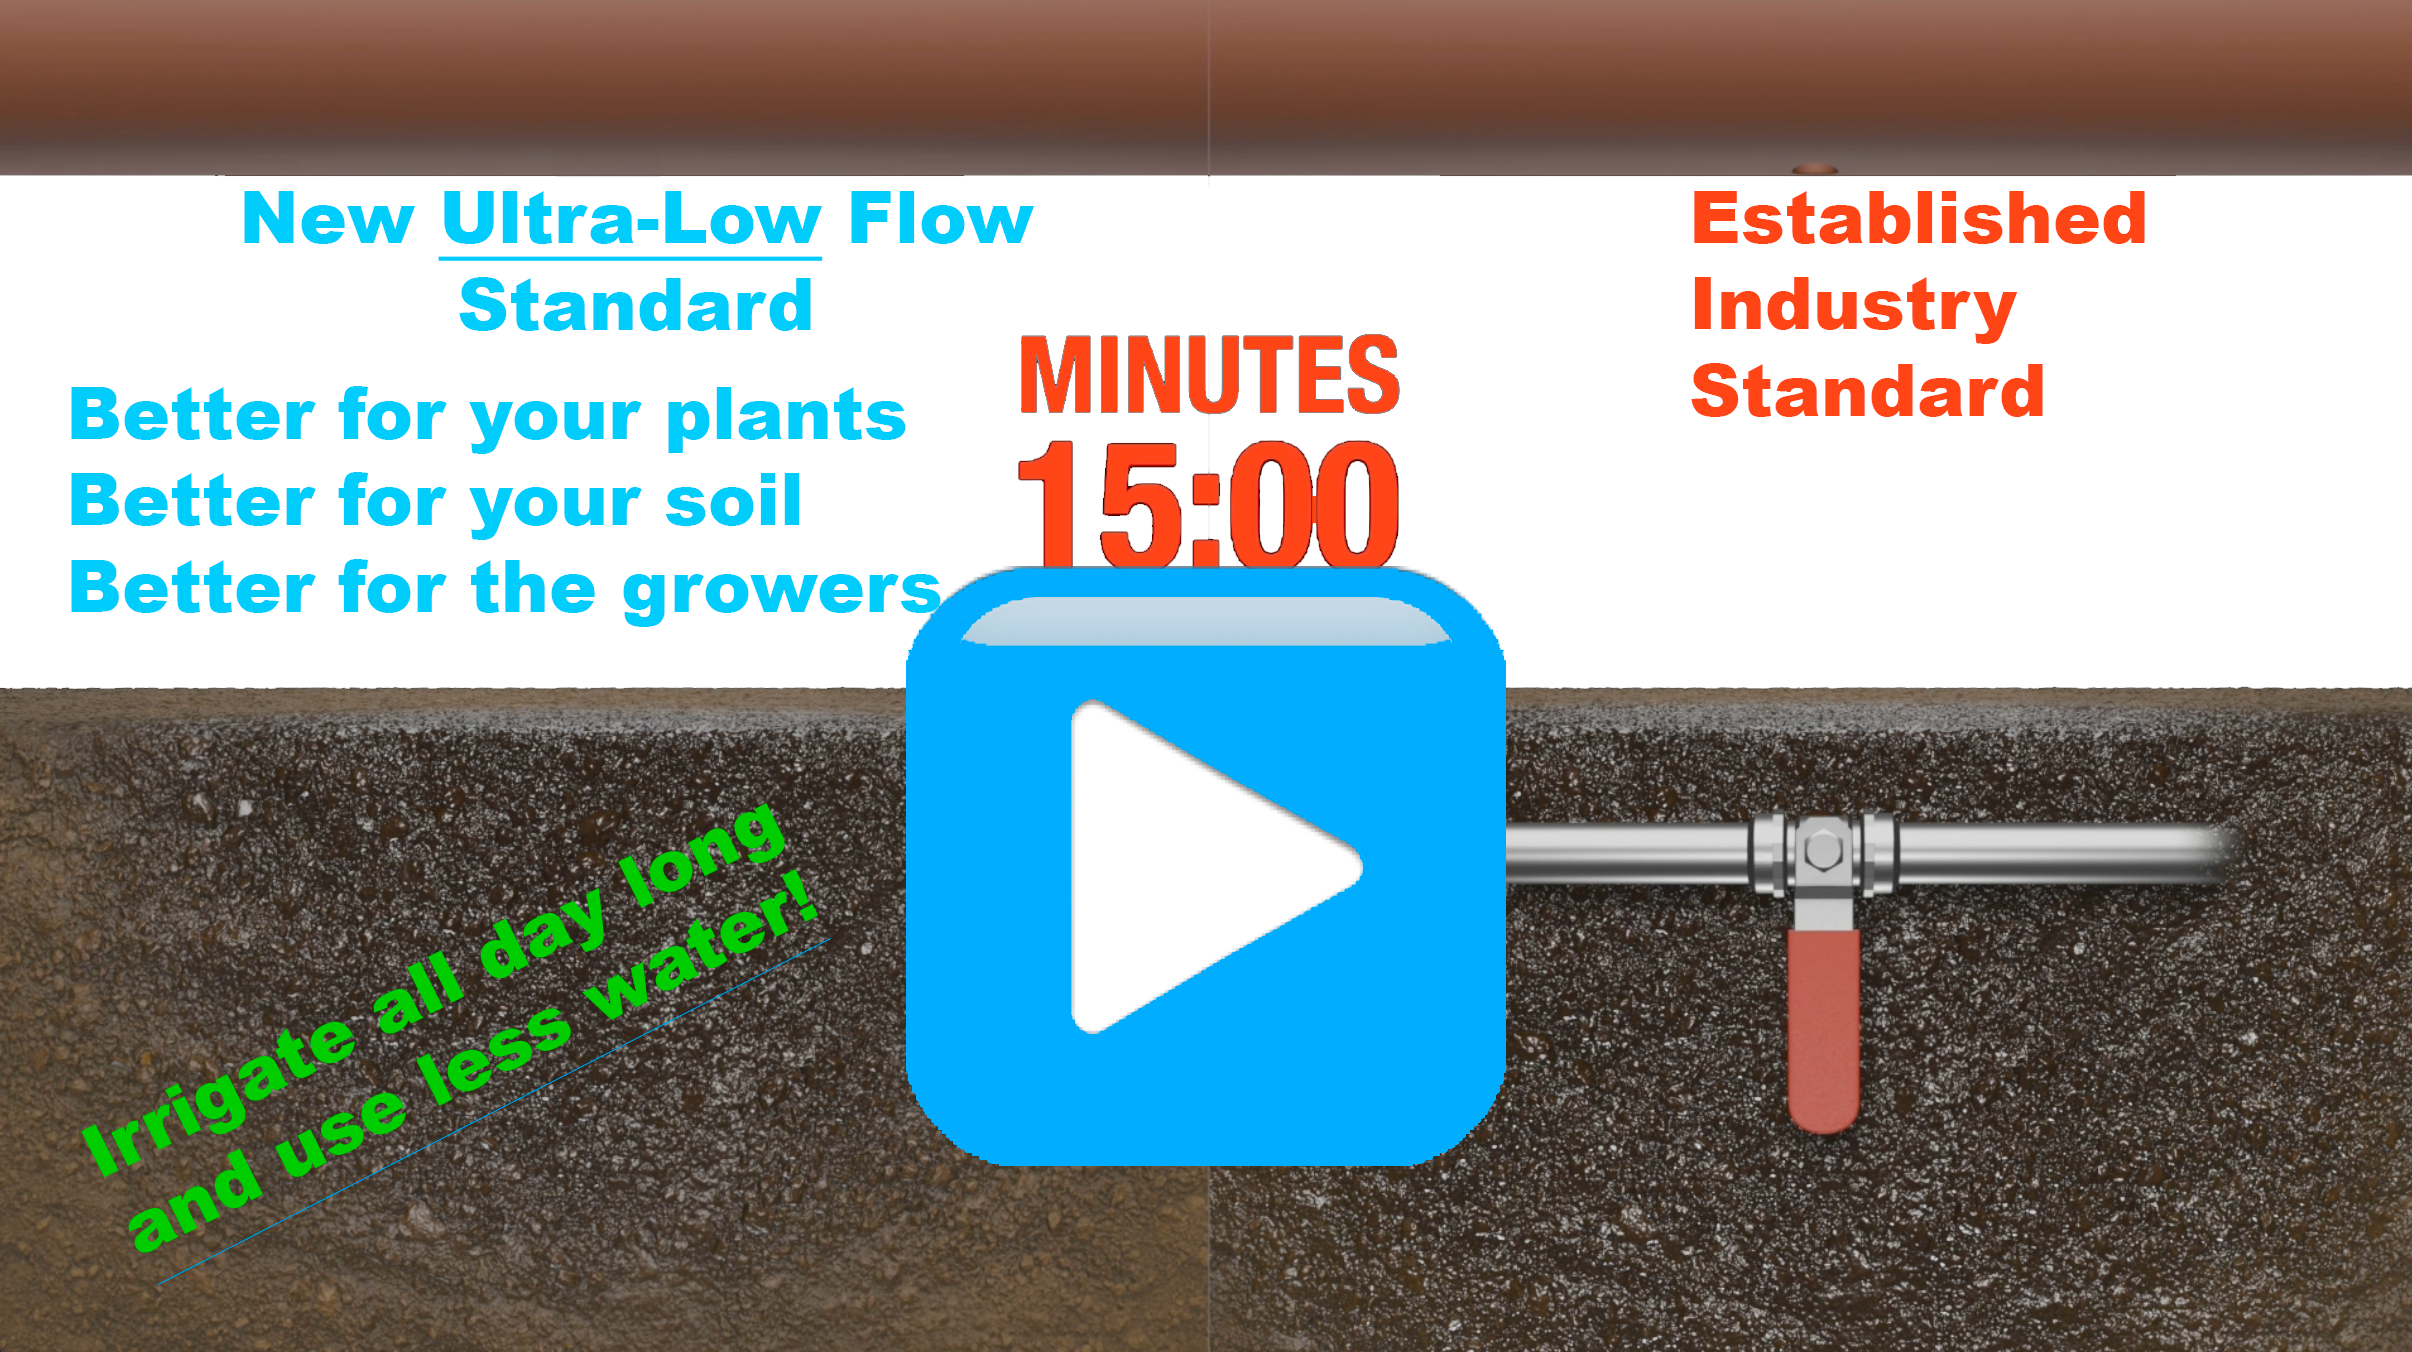
Nano Flow (24 hours) vs. Traditional (15 minutes)
Watch The Dropper Series by Nano Flow Irrigation to see why ultra-low flow rates outperform the established industry standard.
Watch The Dropper Series by Nano Flow Irrigation to see why ultra-low flow rates outperform the established industry standard.
Pilot Validation Network
Access
Early technical insight
Influence
Shape future guidance
Visibility
Publishable evidence
Join the evidence network.
Participating sites help define where irrigation systems operating near plant uptake rates are technically and economically practical.
Direct collaboration and visibility into findings from other pilot environments.
Help determine where ultra-low flow irrigation is technically and economically practical.
Support reports, presentations, grant narratives, and future research collaborations.
Participation Includes
Technical review, cross-site comparison, and recognition in shared validation materials.
- Instrumentation support
- Site benchmarking
- Aggregate findings access
- Replication opportunities
- Future design guidance
Technical planning support only
Start public planning here. This tool provides preliminary hydraulic, agronomic, and infrastructure decision support for scenario comparison. Outputs are not stamped engineering plans and should not be used for final design, permitting, construction, or regulatory submission without qualified professional review.

Build Your Own Nano Flow System
Press Start
< 5 minutes
Need a preview first? Use the persistent Guided walkthrough button in the header. Nothing in the preview is saved.
Display units
Document: Preliminary planning output
Intended use: Scenario comparison and professional review
Not intended for: Stamped design, permit use, or construction
This tool estimates hydraulic behavior and planning assumptions. Final site-specific design, approvals, and implementation documents remain the responsibility of qualified professionals where required.
Use the name you want attached to the project record.
Profile
Name -
Project name -
Block name -
Launch Recap
Pilot Evaluation and Validation Framework
Recap from Feb 20, 2026 on how ultra-low flow continuous irrigation is modeled, screened, and validated under real delivery constraints. Review the summary to revisit the gravity pressure data, discharge curves, and the pilot playbook for 2026 deployments.
Launch complete
Held Feb 20, 2026 · 4:00 PM MT
- Pressure window
- 1 to 30 PSI Gravity-capable validation range
- Emitter flow
- 0.0025 to 0.06 GPH Ultra-low flow operating band reviewed in the recap
- Deployment fit
- Surface or subsurface Matched to soil response and delivery constraints
- Screening process
- 1-on-1 technical review Pressure, flow, and reservoir assumptions checked before pilot launch
Use the recap as a technical brief before planning a pilot, grant narrative, or internal infrastructure review.
Demand Simulator
Scenario B
Accepted Industry Standard
Match Discharge To Plant Uptake
Adjust emitter discharge and row geometry to compare conventional on-demand flow with Nano Flow Irrigation's continuous trickle.
On-Demand Impact (Infrastructure, Energy, Water)
A: Nano Flow Irrigation
- GPH
- --
- LPH
- --
- Drops per hour
- --
B: Accepted Industry Standard
- GPH
- --
- LPH
- --
- Drops per hour
- --
| Emitter Spacing (inches) | 18 " | |
| Row Length (feet) | 1000 ' | |
| Number of Rows | 2 | |
| Row Spacing | 5 feet |
Scenario A
Nano Flow Irrigation
Nano Flow Irrigation
Scenario B
Accepted Industry Standard
Flow Converter
GPH
Gallons per hour
--
Liters per hour
--
CC per hour
--
Drops per hour
--
Drops Flow Converter
Measured interval
drops every
seconds
Per Second
--
Per Minute
--
Per Hour
--
Equivalent Flow
0.0000 GPH
If you can turn it on and leave it running… why waste water?
- Supplement plants for longer periods
- Reduce on-demand water and energy
- Ease soil tension and compaction
- Lower flow velocity, friction losses, and infrastructure needs
- Save water while boosting production
Less pressure loss means better uniformity.
Did you know?
There are roughly 20 drops in 0.001 liters of water.
The Dropper Series
Each emitter in The Dropper Series reaches ultra-low flow rates unmatched by conventional drip manufacturers.
The system is designed to run for days or weeks at a time. Set it and forget it. Operating at just 1% of traditional flow, the line delivers a constant, gentle stream that cuts total water use while maintaining plant health.
This steady trickle lets growers run more irrigation sets simultaneously without the risk of runoff or overwatering.

Israel Ruttenberg
CEO & Founder
I grew up around innovators who built low-flow solutions from the ground up. Inspired by my grandfather’s engineering curiosity, I challenge the status quo so growers can do more with less water.
Book a live chat
Technical Evidence
Examine the operating principles
Measure, Model, and Validate
Pressure and FlowMeasured and modeled emitter discharge.
Surface and SubsurfacePlacement, soil resistance, and outlet behavior.
Restriction Mechanisms and FiltrationSystem-level restriction mechanisms and water-quality controls.
Root-Zone BehaviorWetting, tension, aeration, and evidence limits.
Explore the Technical Evidence Hub
Nano Flow Irrigation - Frequently Asked Questions
What problem does Nano Flow Irrigation solve?Root stress • Runoff • Waste
Traditional drip often applies water faster than plants can use it, which drives ponding, percolation losses, and oxygen deprivation in the root zone. Nano Flow Irrigation's drippers operates at about 1 percent of standard flow rates to match plant uptake and stabilize soil moisture.
How do ultra-low flow rates improve drought deficit irrigation and ET balance?
Ultra-low flow maintains a steady, shallow wetting front that tracks evapotranspiration. Instead of large on-off cycles, the profile stays near field capacity with better root aeration and less evaporative loss at the surface.
What is the water-saving potential compared to standard drip or micro?
Systems designed with Nano Flow Irrigation's drippers can reduce discharge per emitter by up to 99 percent while maintaining crop performance, because delivery is paced to plant consumption rather than system convenience.
How do ultra-low flow rates promote uniformity and root health?
At very low discharge, capillary forces dominate over gravity which spreads moisture more evenly around each emitter. The root zone remains moist and oxygenated which supports finer roots and higher nutrient uptake efficiency.
Why do lower application rates reduce root stress and boost yield potential?
Consistent moisture avoids the drought-then-saturation swing that creates plant stress. Stable oxygen and water availability supports flowering and fruit set which can lead to more frequent or stronger yield events.
Can ultra-low flow improve nutrient use efficiency?
Yes. Continuous low-rate delivery maintains solution mobility near roots without flushing nutrients out of the profile which can improve fertilizer efficiency and overall vigor.
How does Nano Flow Irrigation mitigate friction losses and pressure requirements?
Lower velocities reduce frictional head loss which lowers required operating pressure. Fields can run on low-head reservoirs or gravity where practical which cuts energy use and simplifies infrastructure.
Is the Nano Flow Irrigation system complicated to operate?
No. The simplicity is the point. Steady low-rate delivery reduces the need for complex control logic. Scheduling becomes more predictable which makes both sensor-driven and manual decisions easier.
Can I integrate Nano Flow Irrigation with existing manifolds and controls?
In many cases yes. Tubing and laterals can connect to existing valves and manifolds with modest adjustments. Many growers retrofit a test block first then scale after validating results.
How much water can I actually save at the field level?
Savings depend on crop, soil, spacing, and climate. As a planning reference, emitter discharge can drop to as low as 0.0025 gallons per hour with uniformity maintained which materially reduces daily water demand per acre.
Use this planning reference to discuss final set times and volumes with qualified irrigation professionals.
What is the financial impact?
Lower flow and pressure reduce pump size, pipe diameters, and energy consumption. Simpler infrastructure means fewer failure points and lower maintenance. These combine to improve payback and total cost of ownership.
Why choose Nano Flow Irrigation over conventional drip/micro?
It installs like heavy-wall half-inch drip but operates at about 1 percent of the flow rate. That shift turns irrigation into a low-pressure, low-energy, high-control process that supports resilience in water-limited regions.
How does this support long-term water sustainability?
Reducing discharge per emitter at scale preserves regional supplies, improves on-farm reliability, and aligns with conservation programs that reward durable efficiency rather than short-term restrictions.
How does Nano Flow's Dropper Series avoid clogging?
The Dropper Series does not rely on a single micro-orifice to control discharge. Flow is regulated across a distributed pathway, so there is no single choke point where particles are forced to lodge. This makes the emitter less sensitive to particulates than would normally be expected at ultra low flow, while still requiring standard filtration practices.
The system is also designed for continuous operation. This reduces the surge, settle, surge behavior common in canal and scheduled delivery systems, where debris is mobilized during start up and allowed to settle during shutdown.
Clogging in drip systems is typically driven by two conditions: forcing water through very small restriction points and repeated start and stop cycling that creates pressure and velocity spikes.
By minimizing cycling, the emitter avoids repeated mechanical loading seen in pressure compensating diaphragm designs, reducing fatigue over time.
The result is a more stable operating condition that lowers clogging risk and supports longer functional emitter life.
Chat with an agent
Online now
Begin a conversation to be connected.
For example you can ask:
By using this chat, you agree to abide by the Terms & Conditions outlined in the Policy page document where our Privacy Policy is located as well..