Nano Flow Irrigation hero banner
Plan a Pilot

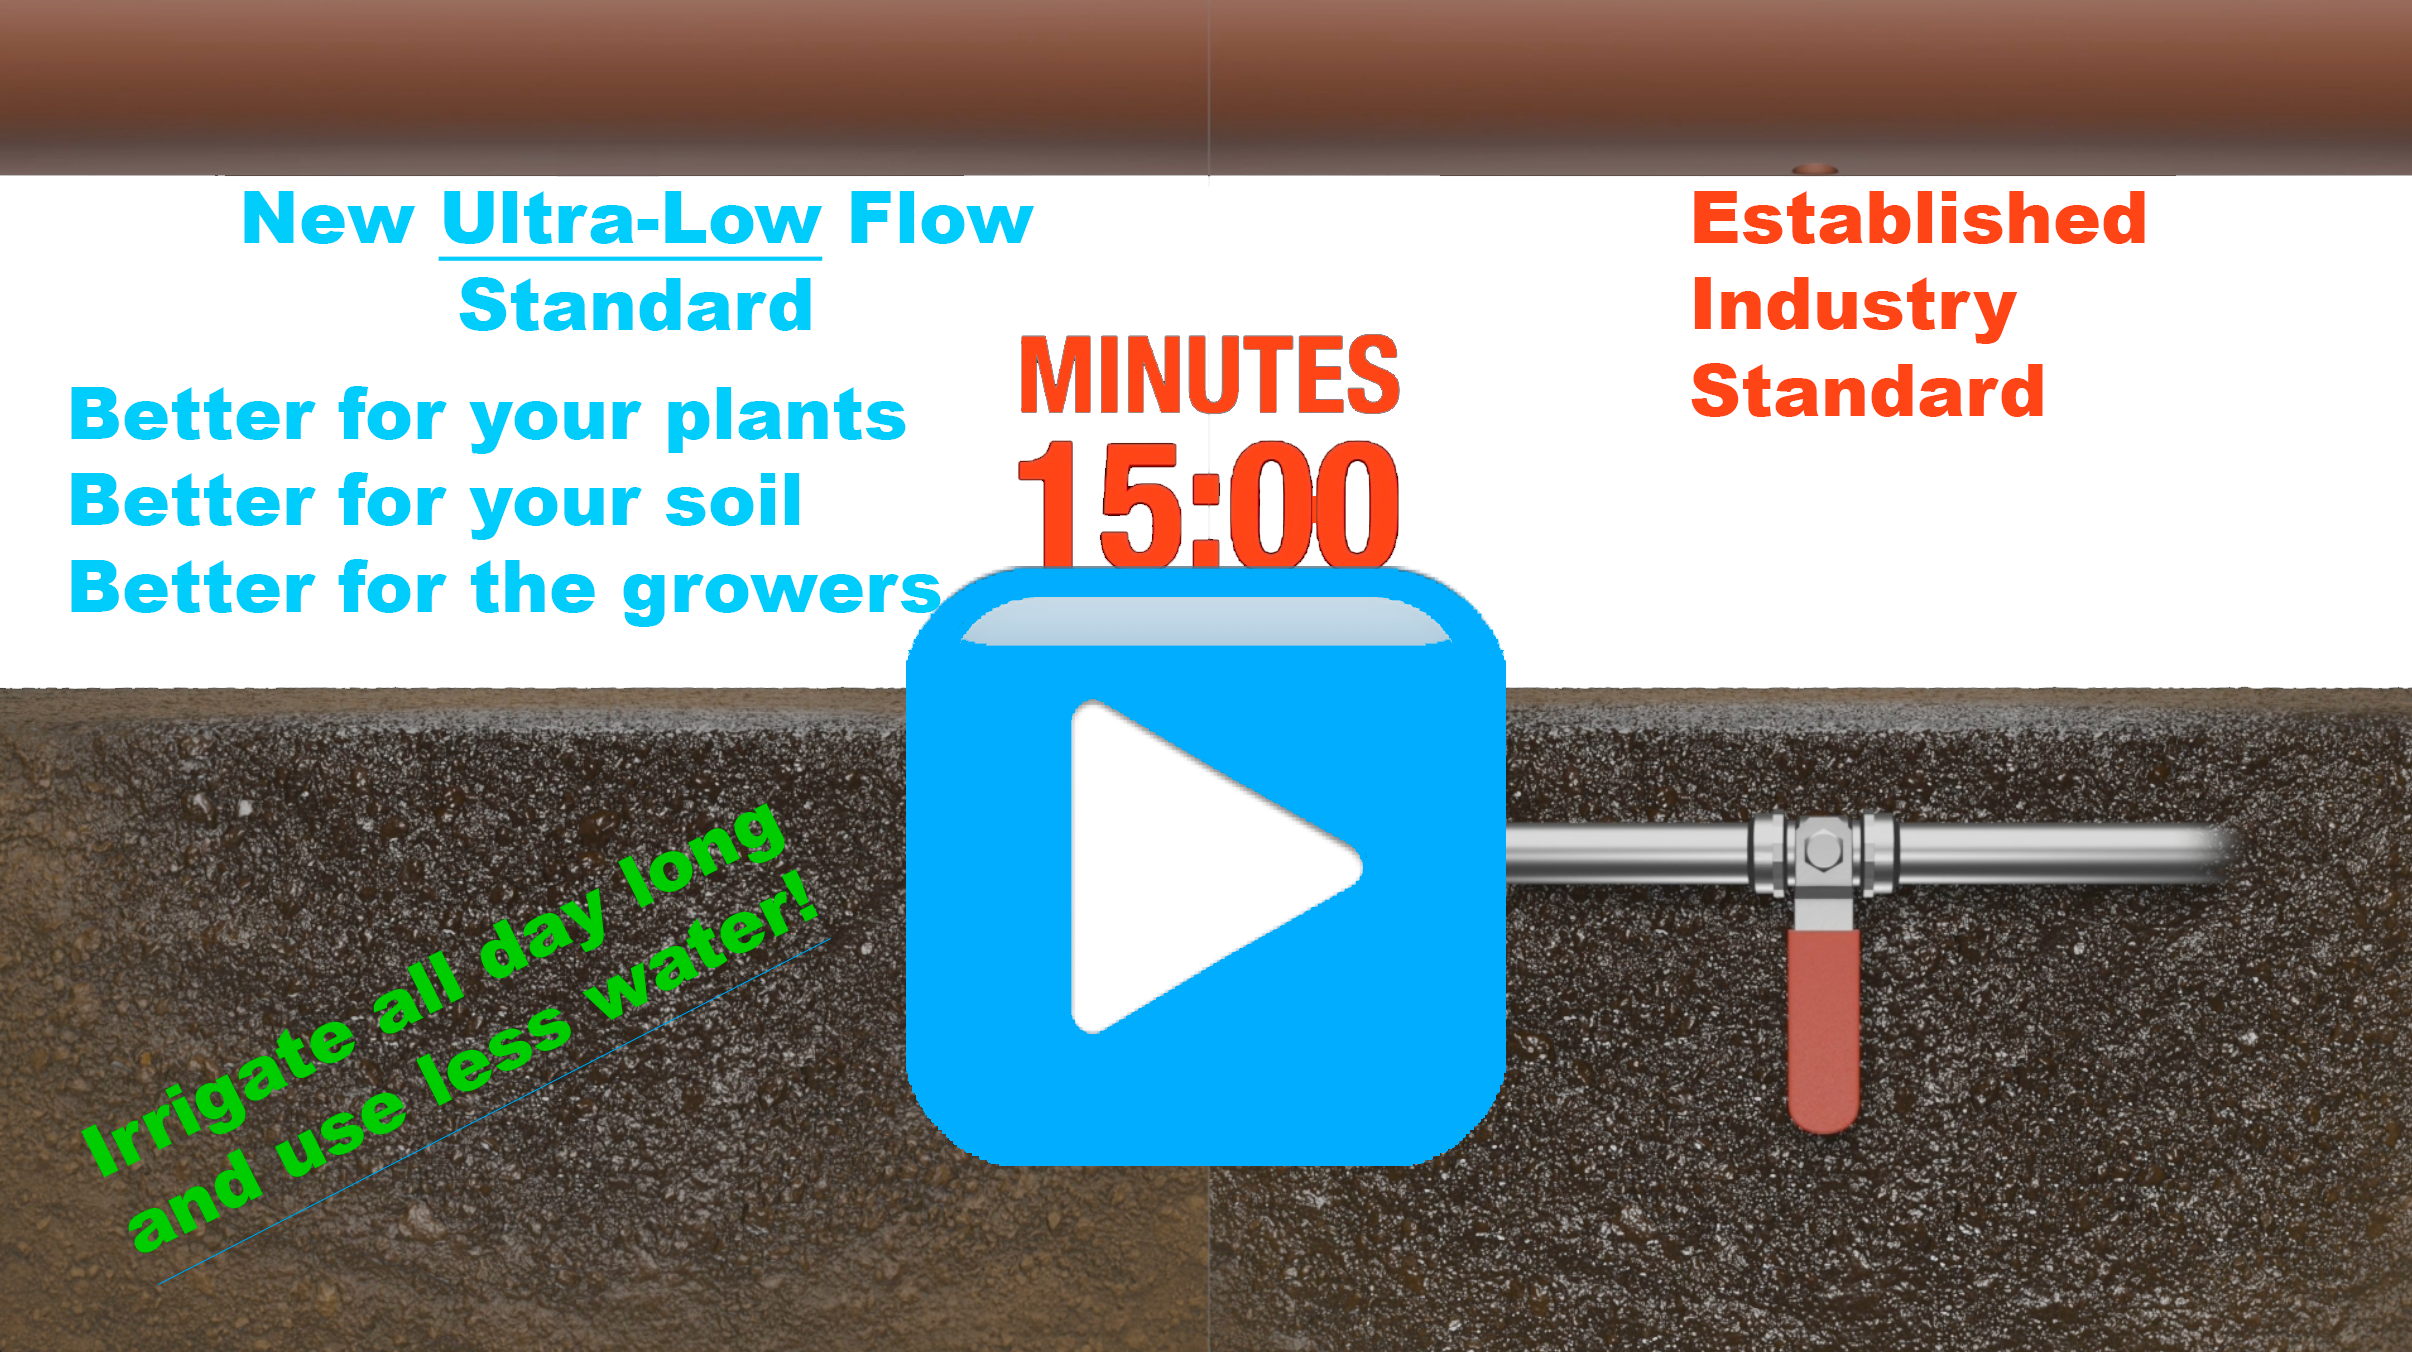
Conventional (Accepted Industry Standard) VS. New Nano Flow Irrigation Irrigation

Left: Conventional
Accepted Industry Standard
Emitter flow (GPH / LPH) --
Conventional
Drops/sec
--
Drops/hr
--
Nano Flow Irrigation
Drops/sec
--
Drops/hr
--
Right: Nano Flow Irrigation
New Ultra-Low Flow Rate Standard
Emitter flow (GPH / LPH) --
Demand Simulator

Match Discharge To Plant Uptake

Adjust emitter discharge and row geometry to compare conventional on-demand flow with Nano Flow Irrigation's continuous trickle.

On-Demand Impact (Infrastructure, Energy, Water)

A: Nano Flow Irrigation

GPH
--
LPH
--
Drops per hour
--

B: Accepted Industry Standard

GPH
--
LPH
--
Drops per hour
--
Emitter Spacing (inches) 18 "
Row Length (feet) 1000 '
Number of Rows 20
Row Spacing 5 feet
Scenario ANano Flow Irrigation
Scenario BAccepted industry standard

Flow Converter

GPH
Gallons per hour --
Liters per hour --
CC per hour --
Drops per hour --

Drops Flow Converter

Measured interval
drops every seconds

Per Second --
Per Minute --
Per Hour --
Equivalent Flow 0.0000 GPH
The Nano Flow Irrigation conversation

Ideas, updates & the story behind the flow.

Swipe or scroll to explore. Take your time with each post.

A fresh perspective

Room to grow.
Start with a pilot.

Israel Ruttenberg wearing a straw hat in an agricultural field.

Explore what ultra-low flow could mean for your irrigation practice.

A field pilot is a chance to evaluate new possibilities against your management goals. Join the conversation with Israel about building evidence and planning the next step.

Explore pilot planning Read on LinkedIn
From the founder

A lifetime in irrigation.
A new way forward.

Nano Flow Irrigation founder-funded investment graphic with Israel Ruttenberg, drip irrigation, and a Yuma pilot field.

Behind Nano Flow Irrigation is a personal drive to rethink how we deliver water to plants.

Follow Israel Ruttenberg on LinkedIn for the story behind the technology, updates from the journey, and a conversation about what comes next.

Connect with Israel Read on LinkedIn
Rethinking the schedule

Turn the flow down.
Explore continuous irrigation.

Post discussing continuous irrigation and reducing repeated soil dry-down cycles: Stop day trading your soil moisture.

What if the irrigation schedule was simply on?

Israel opens a conversation about soil moisture management and the possibility of moving from repeated dry-down and irrigation cycles to continuous ultra-low flow.

Compare flow Read on LinkedIn
A farm-scale opportunity

One farm.
A starting point for production.

Irrigation model comparing Nano Flow Irrigation and conventional flow rates for a 64.28-acre farm.

Explore a 64.28-acre model comparing continuous ultra-low flow with conventional discharge on the same field layout.

The comparison explores how delivery timing changes modeled peak flow and infrastructure requirements. A farm of this scale could provide a practical starting point for a pilot and a path toward Nano Flow Irrigation production.

Explore a farm pilot Read on LinkedIn
Pilot Planning 2026

Continuous ultra-low flow irrigation

Heavy-wall half-inch drip line designed to run continuously at roughly 1% of conventional flow.

~1% flow rate reduces demand for Water Energy Infrastructure
The Challenge

Maintaining Agricultural Productivity Under Increasing Resource Constraints

Agriculture faces growing pressure to produce more with fewer resources. Water scarcity, energy costs, infrastructure limitations, and competing demands on water supplies are reshaping how irrigation systems must operate.

While modern irrigation has dramatically improved efficiency, most systems still rely on delivering relatively large volumes of water over short periods of time, requiring substantial pumping capacity, storage, filtration, and distribution infrastructure.

Can we do more with less?

Beyond Water Savings

Irrigation Doesn't Need High Flow to Deliver Water to a Root Zone

Nano Flow Irrigation is exploring whether productive agriculture can be maintained with dramatically lower irrigation demand.

This approach seeks to reduce
  • Water demand
  • Peak flow discharge
  • Pumping energy
  • Infrastructure
  • Operational complexity
While supporting
  • Crop establishment
  • Root-zone moisture management
  • Productive growing conditions
  • Long-term agricultural resilience
Rethinking Irrigation for a Water-Constrained Future

The Challenge: Do More With Less!

The challenge is maintaining productive landscapes and agriculture as water, energy, and infrastructure become increasingly constrained.

Nano Flow Irrigation is developing and evaluating ultra-low flow irrigation systems designed to help growers adapt to these changing conditions.

Pressure 1 to 30 PSI

Low operating pressure range with substantially lower friction loss at reduced flow velocity.

Flow 0.0025 to 0.06 GPH

Ultra-low discharge range for continuous surface or subsurface irrigation layouts.

Configuration High, medium, or low pressure setups

Configured around field conditions, delivery method, and reservoir strategy.

From Water Delivery to Water Availability

1% Flow. Just Turn It On.

Ultra-low flow irrigation technology designed to help agriculture adapt to increasing water constraints, rising energy costs, and evolving resource demands.

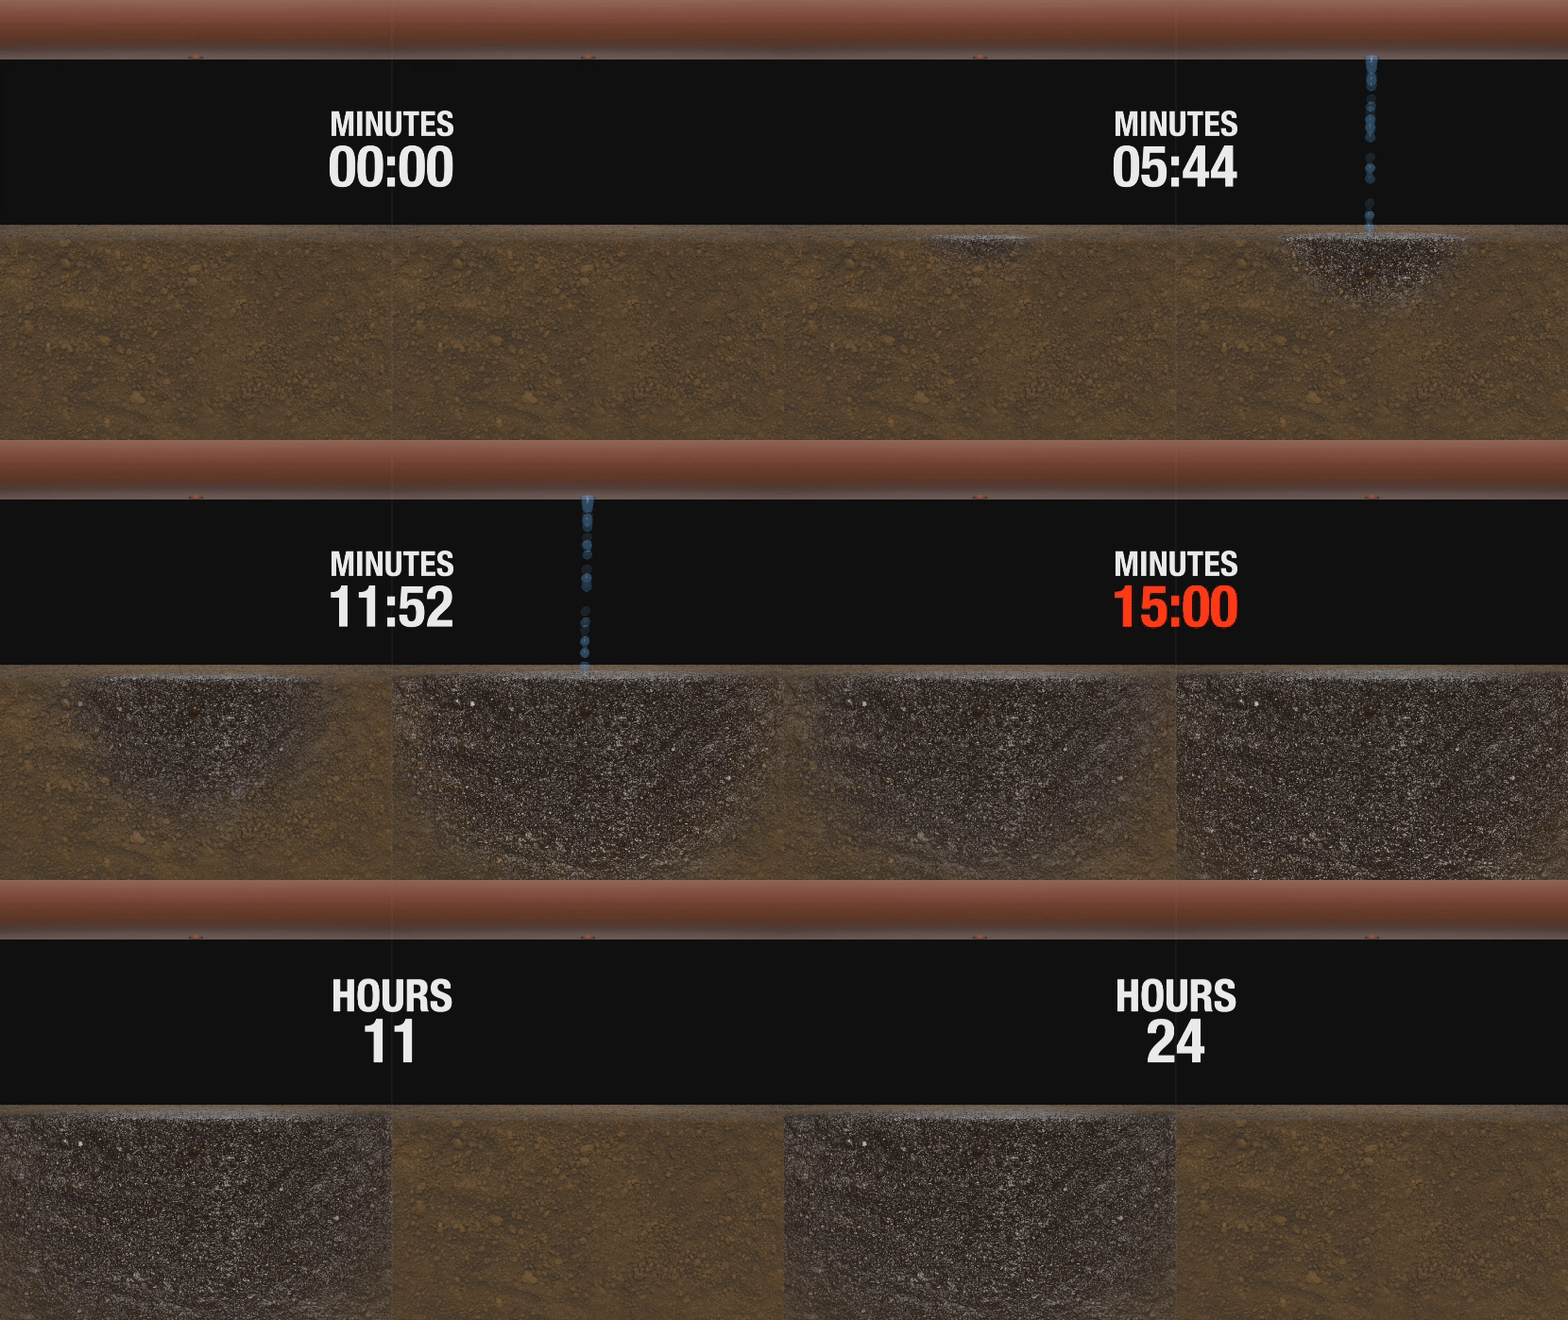
Play the Nano Flow Irrigation irrigation comparison animation
Nano Flow Irrigation (24 hours) vs. Traditional (15 minutes)

Watch the comparison and review its flow rate, pressure, and runtime before drawing conclusions about applied water or field performance.
Technical planning support only Start public planning here. This tool provides preliminary hydraulic, agronomic, and infrastructure decision support for scenario comparison. Outputs are not stamped engineering plans and should not be used for final design, permitting, construction, or regulatory submission without qualified professional review.
Step 1 of 5
Start

Build Your Own Nano Flow Irrigation System

Press Start

< 5 minutes

Need a preview first? Use the persistent Guided walkthrough button in the header. Nothing in the preview is saved.

Display units
Watch the tutorial 6-minute walkthrough

See a 26-acre example, from field layout and water supply to flow modeling and the design handoff.

Watch on LinkedIn ↗

Document: Preliminary planning output
Intended use: Scenario comparison and professional review


Not intended for: Stamped design, permit use, or construction

This tool estimates hydraulic behavior and planning assumptions. Final site-specific design, approvals, and implementation documents remain the responsibility of qualified professionals where required.

Step 2 · Layout & Distribution

Choose what governs irrigation discharge pressure in this design.

Select whether line pressure comes from the source, the reservoir head, or a booster pump fed by the reservoir.
Pressure behavior

Set whether controlled discharge pressure is stable or a time-series signal.

Stable uses a single PSI value. Variable generates a pressure curve over time.
Layout Inputs

Use sliders or type exact values below.

Crop Layout Mode
Emitter Spacing
in
Row Length
ft
Number of Rows
Row Spacing
ft
Key Stats

Live layout and hydraulic snapshot from the current spacing, pressure mode, and selected dropper.

- emitters
- area
Row: - ft · Emitter: - in
Dropper -
Initial pressure -
Initial emitter flow -
Storage Size(Dimensions)
Reservoir geometry and refill cadence are active when storage authority belongs to the reservoir.
Reservoir Templates
Choose by application: IBC totes, vertical tanks, backyard pool-size tanks, or liners.


How long the reservoir must run without refill.


For square, width = length. For circle, leave width empty.

If circle: diameter here. If square: leave blank or same as width.

Enter the starting water height for the reservoir.

Adds head pressure: psi gain = ft × 0.433. Default 0 for ground level.

Enter time horizon, pick shape, and dimensions.
Dropper flow curve preview
D100 - D200 - D300 - D400

Pick one class-specific flow vs. pressure curve (100 / 200 / 300 / 400).

Surface uses the measured curve. Subsurface applies soil matrix resistance to the operating curve.

Subsurface models subtract 2.5 psi for matrix resistance, then reduce flow by the selected restriction factor.

Flow (GPH) vs Pressure (psi) Pressure (psi) Flow (GPH)
Dropper 100 Dropper 200 Dropper 300 Dropper 400

Step 3 · Flow & Pressure Design

Review usable head, cutoff time, flow decay, and usable volume as the time slider moves.

⚠ Shortfall
-
-
Key stats
- emitters
- area
Row: - ft
Emitter: - in

Dropper -
Initial pressure -
Initial emitter flow -
Water volume - / day / acre
Hydraulic System Behavior
Reservoir discharge simulation based on NanoFlow demand and selected geometry.
Usable volume -
Initial height -
Initial pressure -
Elevation boost -
Total area irrigated -
Average emitter flow until cutoff -
Refill quick ref -
Details
Time until min pressure -
Flow at start -
Flow at end -
Min pressure threshold -
Surplus/deficit vs interval -
Auto-balanced footprint -
Dead volume (below minimum usable pressure) -
Emitter Flow Tach - Avg -
Days -
Current t -
Emitter flow -
Avg emitter flow -
Total water applied at t -
Days -
Current t -
Height -
Pressure -
Pressure from height -
Pressure from elevation -
Emitter flow -
Total flow -
Total water applied at t -
Gallons per acre per 24 hours -
Remaining usable vol -
Remaining time to min pressure -
Visualize usable head, cutoff time, flow decay, and usable volume.
Height -
Pressure -
Total flow -
Remaining usable -
Instantaneous emitter flow -

Only water above the minimum usable head contributes to irrigation.

Pressure + flow over time
Pressure Total flow Hydraulic cutoff
Cumulative usable volume
Usable volume delivered
-

Water Application Summary

Total Volume Delivered - -
Application Rate - System average discharge
Delivery Method Continuous distribution No peak-demand irrigation event
Water Control Basis Flow x time Not schedule-based

Water is applied continuously at a controlled rate, rather than in discrete irrigation events.

Modeled scenario assumes constant demand. Field runtime may extend based on crop stage and reduced demand over time.

Flow curves synced to inspect playhead
D100 - D200 - D300 - D400
Flow (GPH) vs Pressure (psi) Pressure (psi) Flow (GPH)
Dropper 100 Dropper 200 Dropper 300 Dropper 400

Step 4 · Infrastructure & Cost Analysis

Compare the accepted industry-standard system against Nano Flow Irrigation irrigation as a system consequence comparison, not just a product comparison.

Projection scale: models what this same design logic looks like at 5x, 20x, or 50x capacity. Your actual build remains unchanged.

Accepted Industry Standard

17
At 40.0 max set flow available.

Nano Flow Irrigation

1
At 40.0 max set flow available.
Set reduction: 94.1%
Hydraulic architecture: Gravity Reservoir

Reservoir head governs pressure and runtime.

Set reduction derived from max flow per set and on-demand flow. Review engineering cost analysis data.

Capacity snapshot
Uses your entered max flow per set and calculated demand.
Max flow per set 40.0 max set flow
Total flow · Accepted Standard 666.67 gpm
Total flow · Nano Flow Irrigation 6.667 gpm
Item Accepted Standard Nano Flow Irrigation
Pump $62,000 (Over 300 HP) $1,800 (Below 10 HP)
Filter $3,400 (4" disc filter) $120 (3/4" spin-down filter)
Mainline pipe $9,200 (4" PVC) $520 (1" poly)
Dripline cost $16,800 (benchmark conventional) Finish with Cost Analysis Request.
Valves/Sets $20,400 (~17 sets) $960 (~1 sets)
Controls $2,500 $2,500
Total Infrastructure Cost $114,300 Cost review required
Beta · DXF SIM

Interactive conceptual irrigation design

Generate a live layout from this build, move intelligent objects, inspect hydraulic effects, review the material schedule, and export a layered editable DXF.

Launch the simulator to generate a design from the current hydraulic model.

Save this comparison or request a cost review in the final handoff.

Hydraulic Snapshot

Key Stats

Dropper
-
Acres irrigated
-
Initial emitter flow
-
Average emitter flow over modeled interval
-
Average emitter flow until cutoff
-
Average Total System Flow
-
Delivered volume
-

Discharge Pressure Behavior

Horizon-averaged line pressure
-
Pressure range
-
Pressure authority
-

Hydraulic System Summary

Design mode
-
Storage authority
-
Refill interval
-
Operating pressure
-

Step 5 · Technical Design Handoff

Your preliminary build

Ready for the next conversation.

Preliminary planning estimates. Site conditions and the operating schedule need technical review before final design.

Current draft
Estimated infrastructureEstimate pending review

Modeled irrigation sets · Conventional → Nano Flow Irrigation -

What happens as you scale?

A quick reference to the same capacity projections in Step 4. Your actual build stays at 1×.

CapacityAreaSets
Conventional → Nano
Component estimate
Conventional → Nano

Same layout density and available flow per set. Equipment costs use Step 4’s sizing bands, so costs and set counts do not simply multiply. Projections require site and operating-schedule review. Confirm equivalent scope, capacity, and operating requirements before comparing costs.

Take the infrastructure opportunity into your technical review.

Keep your cost comparison, modeled irrigation sets, scaling reference, and design assumptions together. We’ll email your saved handoff and a link to continue from this build.

We use these details to deliver your build and respond to any review you request. This does not subscribe you to marketing emails. Saved links are available for 60 days.

Next to verify

    Inside your technical handoff Layout, hydraulics, equipment, and review requirements

    This package is a preliminary design basis, not a construction drawing or final equipment schedule.

    Advanced export tools
    Emitter Flow -
    Average System Flow -
    Delivered Volume -
    Operating Pressure -

    Operating Configuration

    Hydraulic configuration pending

    Operating behavior will appear here.

    Pressure range -
    Storage -
    Modeled operating interval -
    Pressure behavior -
    Source authority -

    Hydraulic Interpretation

    Hydraulic condition pending

    Hydraulic interpretation will appear here.

    Final field performance will depend on line length, elevation change, emitter count, filtration, and measured discharge uniformity.

    Session Projection Analysis

    Test capacity scenarios during this viewing session. These controls do not modify the saved build.

    Build Assumptions · Show all technical inputs

    Hydraulic Snapshot

    Key Stats

    Dropper
    -
    Acres irrigated
    -
    Initial emitter flow
    -
    Average emitter flow over modeled interval
    -
    Average emitter flow until cutoff
    -
    Average Total System Flow
    -
    Delivered volume
    -

    Discharge Pressure Behavior

    Horizon-averaged line pressure
    -
    Pressure range
    -
    Pressure authority
    -

    Hydraulic System Summary

    Design mode
    -
    Storage authority
    -
    Refill interval
    -
    Operating pressure
    -

    Hydraulic Interpretation

    Hydraulic condition pending Comparison condition pending

    Hydraulic interpretation will appear here.

    This summary reflects hydraulic behavior only.

    Design Snapshot

    Dropper
    -
    Horizon-averaged line pressure
    -
    Pressure range
    -
    Initial emitter flow
    -
    Average emitter flow over modeled interval
    -
    Average emitter flow until cutoff
    -
    Average Total System Flow
    -
    Delivered volume before cutoff/window
    -
    Refill interval
    -
    Pressure authority
    -
    Storage authority
    -
    Design mode
    -

    Conventional Equivalent Scenario

    Dropper initial emitter flow
    -
    Conventional equivalent emitter flow
    -
    Peak flow requirement
    -

    Derived conventional flow assumptions updated.

    Consequences

    Max flow per set used
    -
    Accepted standard sets
    -
    Nano Flow Irrigation sets
    -
    Hydraulic architecture
    -
    Pump sizing class
    -
    Filter sizing class
    -
    Mainline sizing class
    -
    Cost analysis status
    -
    Conventional vs Nano Flow Irrigation

    Root-Zone Moisture Stability

    See how continuous ultra-low flow delivery can reduce excess application by maintaining moisture inside a narrower working band.

    Water savings are illustrated as avoided over-application, not reduced plant access to water.

    Conceptual Pivot

    The question is not how fast water can be applied. The question is how much excess water must be applied to keep the root zone functional.

    Root-Zone Moisture Stability and Applied Water Efficiency

    Relative soil water status vs Time

    Panel A: Conventional event irrigation Over-applied / drainage-prone Target moisture band Too dry Drainage loss Dry-back swing Surface overshoot Time Relative soil water status Panel B: Nano Flow Irrigation continuous delivery Over-applied / drainage-prone Target moisture band Too dry Stable working band Less overshoot Time Relative soil water status
    Conventional event irrigation
    • High-flow pulses overshoot the target moisture band.
    • More gross water is applied to maintain coverage through dry-back.
    Nano Flow Irrigation continuous delivery
    • Steady low input holds moisture closer to the target band.
    • Less overshoot reduces excess applied water.
    Hydraulic Narrative & Saved Report

    The explanatory hydraulic narrative is retained separately from the drawing handoff.

    Founding Validation Consortium 2026 Founding Validation Consortium

    Use this build as the starting point for a validation pilot. Validate This Configuration in the Field

    The next step is not a generic quote request. It is a technical conversation about whether this scenario belongs in the 2026 validation program and what evidence the site can produce.

    This shared build is a preliminary hydraulic model. The 2026 Founding Validation Consortium connects qualified projects with pilot planning, instrumentation, performance datasets, and technical partners.

    From concept to professional review

    Tell us about your project.

    Inspect the work first, begin with your property information, or bring the design files and field evidence you already have.

    Start From Your Property

    Request a concept layout, hydraulic design candidate, or professional-review package.

    Turn measurements and project information into a preliminary layout.

    • Site, planting, and elevation basis
    • Water source, storage, and pressure
    • Pilot sizing and intended reviewer
    Request a Site-Specific DXF Preliminary planning workflow

    Preliminary planning boundary: Preliminary layouts accelerate professional review. Final equipment selection, field verification, construction approval, and professional responsibility remain with the project’s qualified designer or contractor.

    Launch Recap Held Feb 20, 2026 · 4:00 PM Mountain Time
    Launch Recap

    Pilot Evaluation and Validation Framework

    Recap from Feb 20, 2026 on how ultra-low flow continuous irrigation is modeled, screened, and validated under real delivery constraints. Review the summary to revisit the gravity pressure data, discharge curves, and the pilot playbook for 2026 deployments.

    Launch complete
    Held Feb 20, 2026 · 4:00 PM MT
    Pressure window
    1 to 30 PSI
    Gravity-capable validation range
    Emitter flow
    0.0025 to 0.06 GPH
    Ultra-low flow operating band reviewed in the recap
    Deployment fit
    Surface or subsurface
    Matched to soil response and delivery constraints
    Screening process
    1-on-1 technical review
    Pressure, flow, and reservoir assumptions checked before pilot launch

    Use the recap as a technical brief before planning a pilot, grant narrative, or internal infrastructure review.

    If you can turn it on and leave it running… why waste water?

    • Supplement plants for longer periods
    • Reduce on-demand water and energy
    • Ease soil tension and compaction
    • Lower flow velocity, friction losses, and infrastructure needs
    • Save water while boosting production

    Less pressure loss means better uniformity.

    Did you know?

    There are roughly 20 drops in 0.001 liters of water.

    Animation of Nano Flow Irrigation's fast valve loop

    The Dropper Series

    Each emitter in The Dropper Series reaches ultra-low flow rates unmatched by conventional drip manufacturers.

    The system is designed to run for days or weeks at a time. Set it and forget it. Operating at just 1% of traditional flow, the line delivers a constant, gentle stream that cuts total water use while maintaining plant health.

    This steady trickle lets growers run more irrigation sets simultaneously without the risk of runoff or overwatering.

    Israel Ruttenberg headshot

    Israel Ruttenberg

    CEO & Founder

    I grew up around innovators who built low-flow solutions from the ground up. Inspired by my grandfather’s engineering curiosity, I challenge the status quo so growers can do more with less water.

    Book a live chat
    Research & Development

    R&D performing benchmark pilot studies in real world scenarios.

    Our technical evidence program is developing the field records, measurement methods, and validation standards needed to support responsible public conclusions.

    System HydraulicsPressure, discharge, demand, and distribution measurement.
    Water + SoilSource chemistry, soil acceptance, salinity, and drainage conditions.
    Root ZoneMoisture, tension, wetting geometry, and crop exposure.
    Reliability + Field EvidenceMaintenance, field observations, and validation records.
    Learn More

    Nano Flow Irrigation: Frequently Asked Questions

    What does Nano Flow Irrigation investigate?
    Nano Flow Irrigation evaluates continuous ultra-low-flow irrigation through component benchmarks, preliminary modeling, and field observations. Whether a configuration improves water use, root-zone conditions, or crop performance is a site-specific research question.
    Does lower flow mean lower total water use?
    No. Total applied volume equals flow per emitter multiplied by emitter count and operating time. For example, 0.005 GPH for 24 hours applies 0.12 gallons per emitter, while 0.5 GPH for 15 minutes applies 0.125 gallons. The discharge differs by 99 percent; the daily volume differs by only 4 percent in this illustration.
    What does the roughly 1 percent flow comparison mean?
    It describes an illustrative instantaneous discharge comparison such as 0.005 versus 0.5 GPH per emitter. It is not a universal product specification or a water-savings percentage. Confirm component identity, pressure, runtime, emitter count, and measurement method for each comparison.
    What evidence supports a pilot decision?
    Component tests establish behavior under specified test conditions. Field observations describe a particular site and period. Simulations depend on inputs and assumptions. None alone proves crop, water, energy, or equipment outcomes for another site. A pilot protocol should define the baseline, measurements, sample locations, duration, and decision rules.
    Can ultra-low flow improve root-zone or nutrient conditions?
    This is a hypothesis to evaluate using soil, crop, water-quality, and operating data. Moisture distribution, aeration, salinity, and nutrient movement depend on site conditions. Do not assume continuous delivery prevents stress, percolation, runoff, or nutrient loss.
    How could flow affect infrastructure and energy?
    Lower instantaneous flow can reduce friction losses in a given pipe configuration. Required pressure, equipment sizing, pump efficiency, runtime, and total energy must be evaluated together. Calculated infrastructure and cost differences are planning scenarios, not guaranteed savings.
    Can I use existing equipment?
    Compatibility depends on the actual components, pressure regulation, filtration, pipe layout, controls, and installation. Arrange site-specific technical review before modifying an operating irrigation system.
    How should an evaluation be monitored?
    Record component identity, pressure, flow or collected volume, duration, sample locations, water quality, and relevant environmental conditions. Monitor crop stress and equipment behavior. Define stop conditions and response responsibilities before operation.
    What about clogging and maintenance?
    Clogging performance requires testing with the specified component, water quality, filtration, operating conditions, and maintenance procedure. No blanket clog-resistance or service-life guarantee is made by this website.
    Does an inquiry commit me to a purchase or pilot?
    No. An inquiry or preliminary model does not place an order, reserve inventory, authorize payment, or enroll you in a paid pilot. Scope, pricing, responsibilities, data rights, and any warranty terms must be agreed separately.
    Who owns customer measurements?
    Customers retain rights in their submitted records. Authorized tracking and export are permitted. Rights in joint developments and research findings belong in a project agreement. Identifiable case studies or publication require separate authorization.